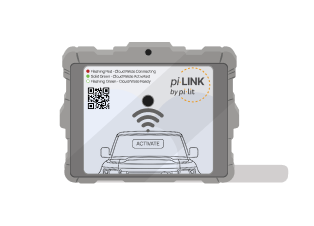
Your crew sets the taper. pi-lit Cloud warns approaching drivers and tracks every deployment automatically, across every connected Sequential Flare, Smarter Cone, smart taper lamp, and piLINK gateway.
Every deployment is matched to its own road segment and time window, then compared with that segment's free-flow baseline. You see the slowdown, not just the activation.
One utility fleet · 12 months · September 2025 to August 2026
16,594
Qualified deployments
8.9mph
Mean drop across the 864 deployments that slowed most
23.8%
Measurably slowed traffic
11,680
With usable speed data
One of these moved traffic. Telling them apart is what you are buying.
Matched on purpose: same road class, same 37 mph free-flow baseline, same daylight hours, near-identical length. One held traffic around 24 mph for four and a half hours. The other did not move it at all. Neither crew could have told you that; it is visible only because every deployment is measured against its own road segment.
Traffic slowed, and stayed slowed
Secondary road · 4h 32m · 273 speed readings
36.8mph free flow
23.8mph measured
−13.0mph difference
mph measured mph free flow
Measured traffic speedFree-flow baseline for this segment
Secondary road, 4 hours 32 minutes, 273 readings. Free-flow baseline 37 mph. Traffic held around 24 mph for the whole deployment.
Read the values
Mean measured speed and free-flow baseline per half hour of the deployment, in mph
Elapsed
Measured
Free flow
Readings
0 to 30 min
25.6
36.7
31
30 to 60 min
24.1
36.8
30
60 to 90 min
23.8
36.9
30
90 to 120 min
22.9
36.9
30
120 to 150 min
23.8
37.0
30
150 to 180 min
23.6
36.7
30
180 to 210 min
23.6
36.7
30
210 to 240 min
23.7
36.8
30
240 to 270 min
23.5
37.0
30
270 to 272 min
21.5
37.0
2
Mean of the individual readings in each half hour. The plot draws every reading.
Traffic did not respond
Secondary road · 5h 05m · 305 speed readings
37.0mph free flow
36.7mph measured
−0.3mph difference
mph measured mph free flow
Measured traffic speedFree-flow baseline for this segment
Secondary road, 5 hours 5 minutes, 305 readings. Same 37 mph baseline, same road class, same daylight hours. Traffic did not change.
Read the values
Mean measured speed and free-flow baseline per half hour of the deployment, in mph
Elapsed
Measured
Free flow
Readings
0 to 30 min
37.0
37.0
30
30 to 60 min
37.0
37.0
31
60 to 90 min
37.0
37.0
30
90 to 120 min
36.1
36.9
30
120 to 150 min
37.0
37.0
30
150 to 180 min
35.0
36.8
30
180 to 210 min
37.0
37.0
29
210 to 240 min
36.6
36.9
30
240 to 270 min
37.0
37.0
30
270 to 300 min
36.8
37.0
30
300 to 305 min
37.0
37.0
5
Mean of the individual readings in each half hour. The plot draws every reading.
The deployment on the left is one of the 864 that slowed traffic by 6 mph or more, representing the top 7% of measured deployments. The one on the right is the common case: 76% of measured deployments show no change over 1 mph.
View full speed breakdown across all 11,680 events by road type
Where it worked, and where it did not
Mean traffic speed with and without piLINK, by road type, in miles per hour
Road type
Events
Free flow
With piLINK
Share slowed
Secondary road
5,499
42.8
41.4
27.8%
Local road
5,366
37.8
36.9
21.4%
Major road
363
60.2
58.6
20.1%
Motorway
452
69.2
68.9
4.9%
All measured
11,680
42.1
40.9
23.8%
Speeds in mph, each deployment measured against its own road segment's free-flow baseline. A qualified deployment ran at least two minutes.
25%
Risk at 33 mph
→
10%
Risk at 25 mph
Why averages undersell it.
On the 864 deployments where traffic slowed most, the roads' normal speed was 33.5 mph and traffic measured 24.6 mph. That moves a struck worker from roughly a one-in-four chance of death to one in ten, and gives an approaching driver about 20 feet more road over a 1.5 second reaction. Nothing at dispatch marks those jobs out beforehand, which is the case for covering every deployment.
Measured population is piLINK gateway activations, 99.4% of them started by the vehicle light bar. Sequential Flares were recorded on under 1% of these deployments, so these figures measure the digital alert, not the flares. Traffic speeds from commercial real-time traffic probe providers, matched to each deployment's road segment and time window. Impact-speed risk from Tefft (2011), AAA Foundation for Traffic Safety; the curve describes outcomes if a collision occurs, not whether one occurs. Example figures are from one piLINK customer's 1 September 2025 to 31 August 2026 reporting period. Customer name withheld.
AUTOMATED TAPER RECORD & ANNUAL FLEET REPORTING
One deployment, or the whole year.
SCENE & TAPER RECORD
Every cone and flare knows where it was put down.
The app geo-stamps each connected device as the crew places it. When the road reopens, the taper is still in the record: length, spacing, placement order, and how long it took to set, read against the MUTCD guidelines your agency configures. Nobody measures a taper with a wheel, and nobody files a report for this to exist.
Scroll sideways to follow the closure.
What the record says about this closure
9
Connected devices geo-stamped
In placement order, with the time each went down
268 ftTo review
AMerging taper length
320 ft guideline at 40 mph across a 12 ft lane
33.5 ftWithin guideline
Mean device spacing
40 ft guideline maximum in a taper
62 ftTo review
BWidest gap, devices 5 to 6
40 ft guideline maximum in a taper
3 min 08 s
Time to place the taper
First device down to last device down
Read the values
Each connected device in placement order, with the time it was placed and its distance from the device before it
Device
Placed
From previous
Along taper
1
0:00
-
0 ft
2
0:22
31 ft
31 ft
3
0:44
34 ft
65 ft
4
1:06
33 ft
98 ft
5
1:28
32 ft
130 ft
6
2:08
62 ft
192 ft
7
2:28
26 ft
218 ft
8
2:48
25 ft
243 ft
9
3:08
25 ft
268 ft
Illustrative deployment: a diagram of what the analysis reads, not a screenshot and not customer data. Longitudinal distance is compressed about five times against lane width: a 268 ft taper across a 12 ft lane is far shallower on the road than it can be drawn on a page. Guideline values follow the MUTCD merging-taper formula (L = W × S² ÷ 60 at 40 mph or less) and the taper device-spacing guidance of one foot per mph, and are configurable per agency. pi-lit Cloud flags geometry for review; it does not make a compliance determination.
One deployment
Review this deployment
The scene map, placement order and timings, taper length and spacing against your own configured guidelines, attached to the after-action report the crew already generates.
Across the fleet
Improve every deployment
The same read across every crew, vehicle and region. Find the gap that repeats, see whether TIM training moved it, and export the trend for the supervisor who has to defend the program.
WHAT COMES WITH THE PLATFORM
One click, and the year looks like this.
Nobody assembled this. Every bar is deployments your crews already made, logged the moment the warning went live, and waiting on the dashboard whenever someone needs to show what the program actually did.
December ran 1,950 deployments against April's 1,091, with the busiest month almost double the quietest. Whatever drove that, the record already knows which roads, for how long and how traffic behaved, and nobody has to reconstruct it by hand in front of a budget conversation.
deployments hours of live warning named roads
16,594 deployments · 24,651 hours of live warning · 4,855 named roads · median job 47 minutesRead the values
Deployments, hours of live warning and named roads by month
Month
Deployments
Hours
Median length
Named roads
September 2025
1,320
1,508
36 min
766
October 2025
1,336
1,603
36 min
789
November 2025
1,319
1,487
36 min
801
December 2025
1,950
2,425
40 min
1,082
January 2026
1,116
1,546
51 min
666
February 2026
1,181
1,766
55 min
698
March 2026
1,217
3,812
54 min
727
April 2026
1,091
1,979
59 min
659
May 2026
1,298
1,884
53 min
796
June 2026
1,674
2,488
57 min
989
July 2026
1,778
2,357
50 min
1,074
August 2026
1,314
1,797
49 min
797
Total
16,594
24,651
47 min
4,855
Named roads do not sum down the column because the same road appears in more than one month. The total is the count of distinct road names across the year.
One piLINK customer's own year, September 2025 to August 2026. Same account and same method as the measured figures above.
16,594deployments recorded in a year
Every deployment, in context
Start and end time, duration, road name and class, what triggered it, weather, temperature, daylight or night. Nobody filled in a form for any of them; the record is a by-product of the warning going live.
11,680with a measured traffic response
Live and historical speed traces
Each deployment plots real traffic speed against that road segment's own free-flow baseline for that hour, live while the truck is out and kept afterwards. That is the difference between knowing a light was on and knowing whether drivers slowed.
4,855named roads, broken out by class
Cut the way you actually manage
By vehicle, by shed, by road class, by day or night. A 45 mph road is a different risk than a 25 mph road, and a crew that never activates is a different problem than one that activates on the wrong roads.
24,651hours of live warning, in one page
One click to the report
Pick a date range and get a one-page summary you can hand to a director or attach to a renewal. Monthly snapshots arrive on whatever cadence you set.
WHAT EVERY CONNECTED SYSTEM GETS
Know what is on the road, and what happened there.
Live device status
Every connected flare, cone, lamp and gateway is named by account and serial number, with its live status on one map.
Temporary traffic control alerts and events
Activations, alerts and closures are logged as events the moment a deployment goes live, with time and location.
Impact notifications
Get notified when a connected device in the taper is struck or knocked down, so the crew hears about it right away.
Reporting
Pick a date range and get a summary you can hand to a director or bring to a budget conversation.
Cloud access is included with every connected system. Talk to us about plan options for your fleet.